
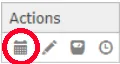
To view an asset’s history, select the History Query icon in the asset’s Actions column. This is found on the leftmost side of your details grid.
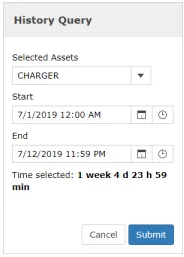
In the window that pops up, input your desired timeline to retrieve history data for, and select “Submit.”
If the selected criteria returns a substantial number of plots the details box will filter out tracking events, however ALL plots will be displayed on the map. If you have a substantial number of plots for the timeframe you selected, we recommend that you either select a smaller time frame or run your data via a History Report.

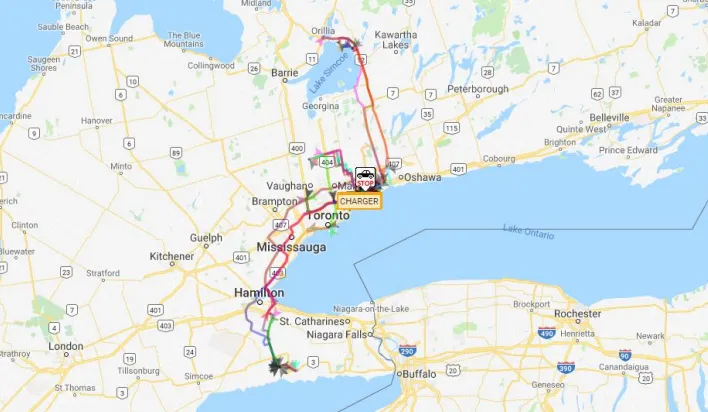
Upon a successful query, you will see travel lines and pinpoints on the map indicating where the asset has traveled in the timeframe you defined in step 2.
TIP: You can zoom in and out of the map by scrolling up or down, or selecting the + / -buttons on the bottom right. You can also use the drag zoom icon in the top left of the map.